A look at the academic papers supporting passive investing over active investing.
Underlying Academic Papers: Markowitz, 1952; Sharpe, 1964; Brinson, Hood & Beebower, 1995; Ibbotson & Kaplan, 2000
tl;dr
- Actively managed funds return a lot less than passively managed funds
- Past outperformance by an actively managed fund gives no assurance that they will continue to do so in the future
- A low management fee is the biggest predictor if a fund will perform well
- Selecting an appropriate combination of stocks and bonds better predicts performance than investment selection
- Stocks are inherently more risky than bonds, but historically have had a higher return
— — —
Active vs Passive Investing
Everyone has heard a story from a friend about someone who made thousands to millions of dollars ‘playing the market’. You’ve likely also seen some movies where a trader figures out a glitch in the market and thereafter make millions. However, these stories benefit from a selection bias, meaning you only hear about the rare large profitable investments and not the much more common losses. The only way to get a good picture of the investment landscape is to look at all of the data points over a long period of time (50+ years).
Fortunately, some of the smartest people (see underlying academic papers above) in the world have dedicated their life’s work to determine how best to go about investing and made their conclusions based off 50+ years of historical investment data. These landmark papers have compared the investment returns of actively managed funds (think mutual funds and hedge funds) to those of unmanaged benchmarks (think of the S&P 500 or the NASDAQ). And based on these comparisons they have concluded the following:
- The average actively managed fund has had a lower return than comparable benchmark’s return (as much as 2.55% a year over a 15-year time frame!)
- The comparison was even worse when accounting for survivorship bias — meaning the funds that don’t perform and are shut down are still taken into account
- Persistence of performance among past winners is no more predictable than a coin flip
The theory underpinning why this is the case is called the ‘zero-sum game’. It states that all of the holdings of investors collectively form the market and that the average performance of the market is just the average of the return of each investor. Therefore, if one investor outperforms the market, another investors is on the opposite side of the trade and is underperforming relative to the market.
To really drive the concept home, let’s try to visualize it. So the diagram below represents all of the returns of every single investor (creating a bell curve) with the center being the return of the market at 6%.
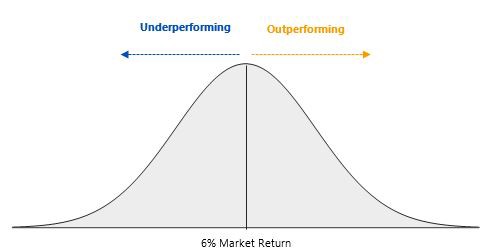
Now let’s add two investors to the return graph, investor A and investor B, with returns of 13% and -1%, respectively. In order for investor A to receive a return of 12% it needs investor B (or alike investor) to be on the opposite side of its trades, otherwise, investor A wouldn’t be able to buy or sell any of its investments. This where the theory ‘zero-sum game’ gets its name. If you were to add up all the returns of each investor, it would always equal the return of the market.

This means that in order for an investor to outperform the market on a repeatable basis it needs other investors continuously on the other side of the equation (underperforming relative to the market) to make the trade work. This begs the question, if you were consistently underperforming relative to the market would you continue to invest the same way? Likely not.
So investors are continuously ‘dropping out’ of the active investing game and merely buying indexes to track the market and receive a 6% return (in this case). This continuous loss of underperforming investors causes the sophisticated outperforming investors to have to compete with each other and end up on the underperforming side of the equation from time to time.
The next thing to factor in is the management fee that active fund managers typically charge, typically ranging from 0.50% to 2.00%. These fees automatically handicap them and force them to not only match the return of the market (which is difficult by itself) but beat it by more than their management fee. Take the example below with a 1.00% management fee:

Because of the active fund managers management fee of 1.00% the entire return spectrum shifts to the left. Although a portion of the blue bell curve does lie to the right of the market return, it represents a much smaller number of investors due to the high management fee.
These facts have even lead Warren Buffet, one of the best (if not the best) active fund managers in the world, to tell his heirs to put his estate into low-cost passive index funds.
“If you can’t find the needle, buy the haystack”
Asset Allocation
Hopefully, by now you agree that it is very difficult (near impossible after fees) to repeatedly outperform the market. If not, come back in 5 years or so when you’ve started to see the light by looking at your own investment returns. The next challenge that the researchers took on was determining the optimal asset allocation. By asset allocation, I’m referring to the mix of bonds, stocks, and cash in a portfolio (there are other asset classes too like real estate and commodities, but we’ll stick with the simple ones for now).
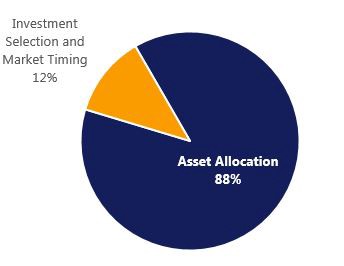
The researchers determined that selecting an appropriate asset allocation is more important than selecting the individual funds that you invest in. In fact, research from Vanguard has determined that 88% of a portfolio’s return can be exampled only by asset allocation, with the remaining 12% determined by investment selection and market-timing (assuming a diversified portfolio).
This means that simply by investing 80% in stocks and 20% in bonds, you’ve already determined your portfolio’s volatility even before selecting stock or bond indexes.
Decades of research have shown that stocks are inherently more risky than bonds. So when figuring out how to invest your portfolio the first thing to determine is how much risk you are able and willing to accept.
Since stocks are inherently more risky than bonds, investors demand a higher return from them. Otherwise, investors would only invest in less risky assets with higher returns. So the general concept is:
More Risk = More Return
Less Risk = Less Return
So a portfolio with 80% stocks and 20% bonds will be lot more risky and likely return a lot higher than a portfolio of 50% stocks and 50% bonds. Therefore, when you’re thinking about how exactly you should invest focus a lot more on the combination of stocks to bonds than the specific investments you’re actually investing in.
