In an unprecedented year with widespread lockdowns, video conferencing has become a part of everyday life for most knowledge workers. This has led to Zoom receiving a >$100B valuation, at the time of writing. Video conferencing and other collaboration tools, have led many companies to report that their levels of productivity have been maintained or even improved.
Yet despite all this talk of the benefits of remote work, video conferencing is still in its infancy. Video conferencing remains a poor substitute for in-person meetings and many executives have been posing important questions about how remote work will affect company culture and long-term productivity, such as:
Video conferencing won’t entirely answer these questions, that’ll depend a lot on the specific company asking them. But, better video conferencing technology will help make working remotely more feasible for companies across the board.
There are two focus areas to make video conferencing better:
Video conferencing focus on the unique advantages that digital has over in-person for specific use cases
Solidify video conferencing ability to adhere to core conversation principles by minimizing latency, building backchannelling, and increasing video quality
Build video conferencing around use cases
Currently, video conferencing is one size fits all, no matter the use case or type of meeting.
The biggest varying factor for the video conferencing design is how many people are in the meeting and if someone is sharing their screen. This design carries over from in-person meetings, where as you add more people the room size changes, seats get added, and screens get bigger.
If video conferencing continues to focus on just mirror in-person meetings, video conferencing will always underperform. It’ll always be an imperfect approximation, not the true in-person experience.
Video conferencing is digital first and the experience should be also. This means focusing on the unique advantages of video conferencing rather than trying to replicate in-person meetings digitally. Each video conference meeting should be customizable by the creator and attendees to accomplish a specific goal. For example, what would a meeting look life it was designed for:
A team brainstorm?
A 1:1 conversation with your manager?
A company all-hands?
A pitch to a prospective customer?
A financial review of the company’s performance?
Follow core conversation principles
Human conversations have certain universal behaviors. These principles are true regardless of use case and are fundamental for video conferencing to get right in order to be superior to in-person meetings.
Minimize latency
To have anywhere close to an equal footing with in-person meetings, video conferencing needs to target latency of <50 milliseconds.
Human conversations have a natural flow and rhythm. As soon as one person finishes talking, the other starts. There is a universal tendency to minimize the silence between turns and not overlap. Research suggests the average silence gap between two people in a conversation is just 200 milliseconds. And this miniscule gap is relatively consistent across cultures, rising to 470 for Danish speakers and falling to just 7 for Japanese speakers.
Even when these small silence gaps occur, it’s rather uncommon for two people to talk at the same time, happening about 17% of time. This is a big reason why video conferencing feels so unsatisfying — instead of a 200 millisecond silence gap and 17% overlap, video conferencing has a 1+ second silence gap and 50%+ overlap.
You know when you hear something you’re shocked by and you let out an audible gasp or when a friend is telling you a story and you say “uh-huh” in agreement?
This is backchanneling. Backchannel is a way the listener consciously shows the speaker their reaction or understanding. It’s a quick verbal response to tell the speaker how you are feeling. As with conversation gaps, backchanneling appears to be a universal human behavior, although the exact behavior changes by language and culture.
Without backchanneling, conversations feel shallower. Video conferencing must build in other ways to backchannel.
Maximize video quality
Albert Mehrabian, a pioneer researcher of body language in the 1950’s, found that the total impact of a message is ~7% verbal, ~38% vocal, and ~55% nonverbal. Although the relative weight is debated, researchers agree that body language is a powerful communication tool. Hence, the reason video conferencing, not phone calls, took off with the switch to remote work.
Video conferencing allows you to see people’s faces. To maintain this strength, it’s fundamental that the actual video be very high quality. You should be able to see the small nuances and reactions of people’s facial expressions.
It’s Day 1 for video conferencing and I’m excited to see where the technology goes from here.
Frameworks and examples from 15 product experts at leading technology companies
Background
This article is part of a larger body of research (see other articles below) about how product managers are incorporating machine learning into their products and was conducted by Brian Polidori and myself while MBAs at UC Berkeley with the help of Vince Law as our faculty advisor.
The research is an attempt to understand how product managers are designing, planning, and building machine learning (ML) enabled products. To develop this understanding, we interviewed 15 product development experts at various technology companies. Of the 15 companies represented, 14 have a market capitalization greater than $1 billion, 11 are publicly traded, 6 are B2C, and 9 are B2B.
How to manage a machine learning model
Product managers need to make trade-offs and consideration when building machine learning (ML) enabled products. Different product use cases call for different ML models. Therefore, learning the core principles for how to manage an ML model is a key product manager skill-set.
Balancing precision versus recall
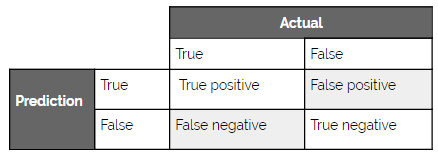
Every ML model will be wrong at some point. Therefore, when building an ML-enabled product, you need to think about the right balance between false positives and false negatives for your specific use case.
Another way to think about this balance is precision versus recall. Where precision is the percentage of true positives among the retrieved instances and recall is the number of predicted positives over the total number of true positives. The reason the relationship is called a balance is that precision and recall are relatively inversely correlated (when all else is equal).
Although only a few interviewees mentioned this balance using the precision versus recall terminology, a significant portion mentioned the importance of finding balance in their specific use case. Google Photos is a good example to start with.
When users type in a search for something in Google Photos, they want to reduce the number of images to make it easier to find exactly what they wanted. Therefore, the goal is noise reduction and, as such, there are limited costs to false positives (since the alternative was looking through all their photos) but high costs to false negative (since what they want might not be surfaced). Hence, Google Photos prioritizes high recall over high precision. Which, as demonstrated in the photo, leads to Google Photos often including images that don’t relate to the search.
On the opposite end of the precision versus recall spectrum, one of our interviewees had an example where their company (a social network) was focused on high precision. The use case was to determine how to rank and recommend content to appear on users’ personal feed. After performing some experiments, the company found that if the recommended content isn’t highly relevant for the user, there is a higher probability of the user churning.
Although this result seems obvious, the nuance was that the highest rates of churn were when the user was on a mobile device. Because of the limited real estate, the recommended content would take up a large portion of the screen and therefore, if the recommended content wasn’t very precise the user would likely churn.
Based on our interviews and research, we’ve created the below general guidelines to serve as a starting point for how to think about what to prioritize.
Key points
When to prioritize recall over precision:
Anomaly detection
Compliance
Fraud detection
When to prioritize precision over recall:
Limited space (e.g., mobile devices, small sections)
Recommendations
Content moderation
Accuracy thresholds
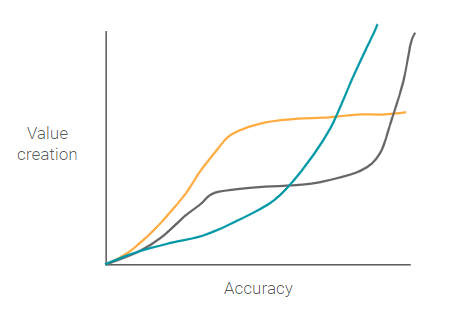
A core part of your machine learning strategy depends on what minimum level of accuracy (the fraction of predictions the model correctly predicts — see the recall and precision section) is needed to achieve product-market fit. A good proxy for product-market fit is value creation, where the more value that is created (for both the company and the users), the better the product-market fit. Thereby, the question becomes, what is the relationship between different levels of accuracy and value creation?
The answer to this question depends on the details of your specific use case. So, let’s go through two examples.
Self-driving cars
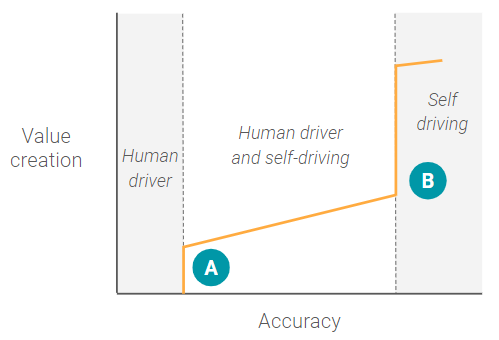
In the beginning, when a self-driving car ML model has a very low level of accuracy, there is zero (or possibly even negative) value creation as a human driver can’t rely on the system at all. At a certain point (A), there is a step-wise function where the ML model has a high enough level of accuracy that a human driver can begin to rely on the system in some highly constrained environments, like freeways where driving is more uniform. Once this accuracy level is reached, there is significant value creation (or product market fit) for that specific use case.
However, after point A, the system reaches a slight plateau where increases in the level of accuracy don’t correspond to commensurate increases in value creation, because the human driver still needs to be involved a portion of the time. For example, the car may be able to park itself a portion of the time, but be unable to handle high-density urban streets, or know exactly where on the side of the street to drop you off. Essentially, the ML model hasn’t yet reached the minimum accuracy threshold for the next use case — full self-driving capability.
Once the ML models reach that minimum accuracy threshold for full self-driving there is a paradigm shift to an entirely new use case that doesn’t involve a human driver at all. At this point, the product team can start thinking about fundamentally changing the product for the new use case, such as adding in entertainment consoles or creating fleets.
Google Photos Search
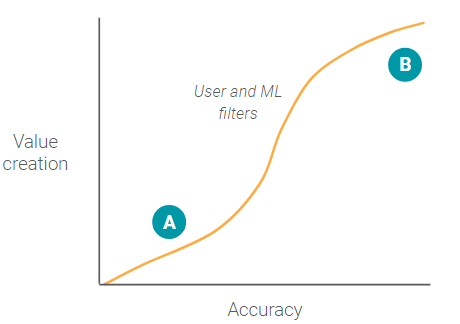
In contrast to the self-driving accuracy value creation graph, the Google photos image search has no large step-wise function.
When a user searches for a specific photo(s), the user types in words to create a filter and reduce the overall number of photos needed to review. Even when accuracy is low, point A, the ML model still creates value by reducing the total number of photos the user needs to look through (assuming the ML model has low false negatives).
As accuracy continues to increase, value creation increases at an increasing rate as more and more irrelevant photos are filtered out. At some point around point B, as accuracy continues increasing, value creation reaches diminishing marginal returns. This occurs because the filter has eliminated the majority of other photos and the user can quickly and easily look at all the photo results without having to scroll.
Every use case will have a different accuracy value creation graph. Therefore, you should carefully think through the characteristics of your specific use case to determine 1) if there are critical accuracy thresholds, and 2) what product changes are necessary above those accuracy thresholds.
Key questions on accuracy thresholds
What is the minimum accuracy threshold needed for my use case?
Is machine learning being used to augment a manual process?
How do the feature requirements of the product change as the percentage of human involvement decreases?
At what point will you be able to completely remove humans from the process?
Is there a point where if the accuracy reaches a certain level the entire use case changes?
Is value creation bounded by zero? Or, in other words, is the maximum value that can be created reducing something to zero, for example reducing fraud to zero?
Exploration vs. Exploitation
One of the major challenges in some machine learning problems is the balance between exploration and exploitation. This problem is often illustrated with a casino scenario called the multi-armed bandit. Imagine a gambler at a row of “one-armed bandit” slot machines. The gambler has the option of testing multiple machines to look for the one that has the highest payout (exploration). Or the gambler can choose a machine and try to build an optimal strategy for winning on that machine (exploitation).
Definitions in terms of maximization (often a metric like click-through rate):
Exploration — Testing various options somewhat randomly in an attempt to find a global maximum.
Exploitation — Optimizing the existing problem space for the local maximum.
This trade-off is common for ML-enabled recommendation products. For instance, Nordstroms’ shopping app has limited screen space to promote products to its users. If it shows users new products or brands the user has never looked at, Nordstrom is exploring to see if there is a higher global maximum for that user. This would give Nordstrom more information about the user’s previously unknown preferences (and possibly discover false negatives), but risk negatively impacting user experience with too many false positives.
On the other hand, in a purely exploitative approach, Nordstrom would show users only products and brands that they’ve looked at or previously bought. This approach would help Nordstroms optimize based only on what it already knows about the user (true positives).
This is not a solved machine learning problem; many of the companies we spoke with are constantly optimizing and adjusting their models to find the right balance. The most likely solution will be an ML model that leverages both exploration and exploitation techniques.
Key points
Exploration is the best way to learn if you have false negatives, but over-exploration could cause many false positives.
Exploitation is a safe approach, but it is limiting and will likely lead to time spent seeking a less optimal local maximum.
This article is part of a larger body of research (see other articles below) about how product managers are incorporating machine learning into their products and was conducted by Brian Polidori and myself while MBAs at UC Berkeley with the help of Vince Law as our faculty advisor.
The research is an attempt to understand how product managers are designing, planning, and building ML-enabled Products. To develop this understanding, we interviewed 15 product development experts at various technology companies. Of the 15 companies represented, 14 have a market capitalization greater than $1 billion, 11 are publicly traded, 6 are B2C, and 9 are B2B.
Data strategy principles
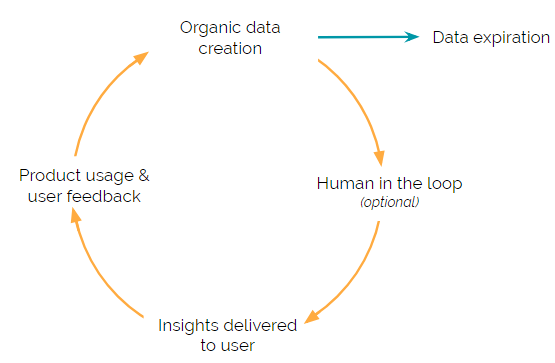
Machine learning (ML) enabled Products have a constant cycle of collecting, cleansing, and analyzing data to feed into an ML model. This repeated cycle is what fuels the ML algorithm and allows the ML-enabled Product to deliver useful insights to users.
Each step in the cycle presents a unique challenge. Therefore, we’ve explored each of the data strategy steps in-depth with frameworks and examples that highlight some of these unique challenges.
Organic data creation
In business, company growth is typically broken down between organic and inorganic growth. Organic growth is growth that arises from the company’s own business activities while inorganic growth arises from mergers and acquisitions. This same concept can be applied to the data creation process.
Organic data creation is when the data (i.e., the data that is used to inform the ML model) is created as a byproduct of the product itself. Inorganic data creation is when the data is acquired (either purchased or freely accessible) from a third party.
All the largest technology companies operate under an organic data creation strategy.
Facebook knows who to recommend to you as a possible friend connection because you’ve already confirmed your friendship with other similar people. Amazon knows what other products you’re likely to purchase because of all your past purchases and browsing history. And Netflix knows which show to recommend next because of the past shows you’ve watched.
One noted exception is when a company is first starting out. A company may need to inorganically acquire data in order to build an initial ML model and over time use that ML model to create the necessary network effects to start an organic data creation process.
Key points (the four main benefits to organic data creation):
Cost-effective — ML models need a large volume of data to train on and this data needs to be constantly updated and refreshed (see the Data Expiration section below).
Representative data — Organic data creation is likely to have data that is representative of your specific users, since it is in fact created by your users.
Competitive advantage — As a natural byproduct, organic data is proprietary and can serve as a competitive advantage that competitors are unable to replicate.
Network effects — Organic data creation can increase the power of network effects because, as users increase, so does the data, leading to improved models.
Human feedback
By its very nature, ML is able to ‘learn’ how to optimally perform a task by receiving feedback — lots and lots of feedback. This feedback primarily takes two forms:
User-generated feedback
Manual human-in-the-loop review
User-generated feedback
User-generated feedback is organic data creation in action. For many use cases, user-generated feedback is relatively easy to capture. For instance, one of our interviewees gave us the following example — which applies generally to all search use cases.
When a user types a query into this company’s website search bar and hits enter — 20 results are shown. Then the user quickly scans the summary text and (most likely) clicks on one of the 20. The user is the one that is selecting from the list — which is key. Although this is rather obvious, it’s important to elaborate and clearly define why this matters.
The only person in the world that knows which of the 20 results presented is most relevant to the user… is the actual user. Anyone else would just be guessing. So, the user is not only satisfying their own needs but also helping train the ML model with the most accurate data available.
Because of this, in-product user feedback is the most valuable type of feedback your ML model can receive. Also, it doesn’t require you to hire people (unlike human-in-the-loop which is discussed below) and is able to scale as your product scales.
Sometimes, it’s harder to capture user feedback and additional elements have to be added to the use case. The key in adding these additional elements is to build the feedback channels in a way that also improves the user experience and ensures partial adoption.
For example, as LinkedIn started to scale it’s InMail messaging service, it decided to introduce two reply options. When a recruiter reaches out to you, LinkedIn provides two responses, “Yes” or “No Thanks.” This was a simple solution that not only improved the user experience by making it faster for users but also gave LinkedIn highly structured user feedback that they could use to train its ML model. Over time, LinkedIn has introduced more ML-enabled Products like Smart Reply which benefits from the same in-product feedback mechanism.
Key points
Create structured feedback points in your product where the user is personally incentivized to opt-in to providing feedback (Facebook photo tagging, LinkedIn recruiter response).
By nature, an individual user’s actions are the most accurate data that an ML model can receive for that specific user.
Leverage user-generated feedback to enhance your ML models and create a reinforcing network effect between users and ML accuracy.
Human in the loop
Human-in-the-loop feedback is when you pay a person to review a specific use case or data set and provide their educated opinion (e.g., labels, yes/no, etc.). You can also think of this human-in-the-loop process as a mechanical turk, although our interviewees suggested that most companies will likely either hire a third-party firm or create an internal team.
Given how unscalable human-in-the-loop feedback is, we were surprised to find that over half of our interviewees said their company was either currently using or planning on using human-in-the-loop to provide structured feedback to their ML models.
To bring the concept to life, let’s walk through an example.
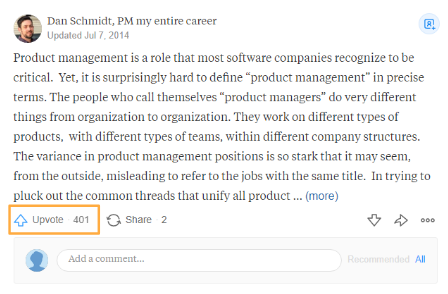
Quora is a question-and-answer website where questions are asked, answered, and organized by its community of users. To sort through all the noise on the platform, Quora allows users to upvote answers, helping quality responses rise to the top.
Quora noticed that some pieces of content would receive a lot of upvotes, but upon review, the quality would be subpar and had devolved into ‘clickbait’ content. Therefore, to enhance the upvote functionality, Quora decided to also incorporate human-in-the-loop feedback. Quora now sends a small percentage of questions and answers to humans who have been trained according to Quora’s standards (more on that below) to rate the quality of the feed on a numerical scale to feed into their ML models.
Human-in-the-loop feedback is, by its nature, a manual process and is therefore very expensive. Due to the prohibitive costs associated with human-in-the-loop, only large companies appear to be extensively using it for feedback. In fact, some interviewees noted that the cost associated with human-in-the-loop helped the company create a ‘moat’ around the business. For example, Facebook is thought to have a team of over 3,000 working on labeling and content moderation.
As we analyzed the use cases where our interviewees were using human-in-the-loop, we found a couple of overarching reasons.
The use case doesn’t have an absolute (i.e., universally true) quantitative metric to measure performance. Therefore, humans reviewers are the highest bar for quality where subjective decisions based on nuanced rules are needed.
The Quora example above illustrates this. For specific posts, the engagement metrics that Quora uses to measure ML outcome success may be high, but the human interpreted quality (relative to stated rules) is low.
There is significant downside risk if the ML model is incorrect and humans have the ability to determine on an individual basis if something is correct or not.
For example, if a social network doesn’t properly perform content moderation, there is a significant public relations risk. Humans who are provided rules can reasonably determine if a piece of content adheres to or breaks those rules.
Taxonomy of rules
One issue that interviewees kept bringing up regarding human-in-the-loop was the difficulty of creating guiding principles, which are used to guide the reviewers doing the manual checking. The guiding principles have to not only be specific enough to limit the amount of ‘grey’ area where a reviewer has to make a subjective decision, but also simple enough so that a reviewer can effectively perform the task.
Many interviewees mentioned that their companies’ guiding principles are hotly debated and constantly in flux.
Key points
Sometimes, user-generated feedback is not sufficient to meet the goals of the product and needs to be augmented with human-in-the-loop feedback
Human-in-the-loop evaluators cost a lot of money and the process to efficiently set up this manual review can be even more costly. However, once these procedures are ingrained into the product process, they can lead to a competitive advantage
Creating a rule taxonomy for human reviewers is difficult. Considerable thought should be devoted to determining the labeling rules to extend the date of data expiration (see data expiration section for more detail).
Data expiration
Of the 15 people we interviewed, 11 mentioned the importance of data timeliness. Some referred to specific regulations or contract requirements that forced them to purge their user specific data after 60–90 days. While others said that the older data was less likely to be informative (see Reddit’s ranking algorithm) or increase predictive value. This data timeliness seemed to apply not only to user-generated data but also to some instances of human-in-the-loop review.
For example, Facebook tries to maintain up-to-date information (e.g., websites, hours, phone numbers, etc.) about the small businesses on its platform. In addition to giving these small businesses ownership of their Facebook page, Facebook also uses a human-in-the-loop reviewer to check a small percentage of the business pages and see if the data is up-to-date.
However, right after a reviewer confirms that a small business’s data is up-to-date, the probability that the data is still up-to-date begins to decrease. As a rule of thumb, we heard that about 6 months after review the data is equally likely to be stale as it is to be up-to-date — however, the time-frame will vary greatly depending on the specific use case.
Companies are in a constant cycle of trying to get new data before their old data becomes stale and irrelevant. This is another reason that companies should have a product built around organic data creation.
Key points
As soon as data is created, its usefulness in ML models begins to decline and, for some use cases, this data decay happens over the course of days to weeks.
Due to the short life of data’s usefulness, companies should focus on organic data creation so that new data can constantly be brought into the system.
Your phone alarm buzzes by the side of your bed. After silencing the alarm, you look through your push notifications, check your email, and scan news articles to see what’s happened in the world. On the way to work you listen to a podcast or audiobook. When your mental stamina starts to drain at work, you take a break, check social media, and maybe read a few more articles. Once work’s over, the headphones are back on for the commute home.
Any of this sound familiar?
It’s certainly true for me.
All of these bits and pieces of information we consume form our information diet.
Originally, I was going to write this article about all the different tech industry resources I gathered from my community that they use to be more informed (which I’ll still be posting soon). However, as I was thinking about my information diet, I realized that most of the information I consume is extremely recently created.
Around 80% of the information I consume is less than one month old.
And at maximum, I very rarely consume information that’s older than five years.
For most books, articles, news, and information to be useful to us, the author typically needs to take some underlying fact (e.g., numbers, events) and add meaning to it. Otherwise, we’d all just be given the raw data and have to come up with all our own theories from scratch. However, here in lies the problem. If we don’t know all the underlying facts of a situation and aren’t experts in that field, how do we know if the theories and opinions we are consuming are correct?
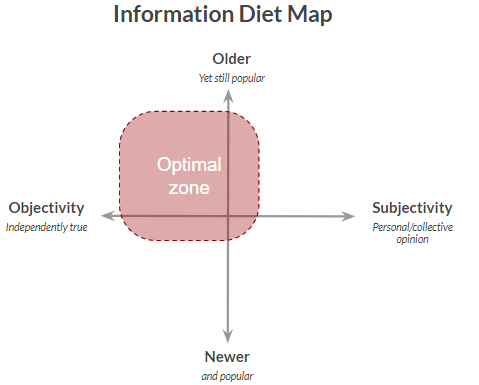
Fortunately, at a high-level I think there is a fairly straightforward framework — use the wisdom of the crowd and error on the side of consuming objective rather than subjective information.
Why read older books?
For general reference purposes, I’ll define older information as over ~10 years old.
By consuming older information, what we’re really trying to do is decrease the likelihood of getting a false positive (that is, an untrue theory or opinion) in the information we consume. We leverage all the people who have already consumed the information and decided both that it’s valuable and that it’s true. The longer a piece of information has been available, the more people are going to have read it and gone through that process. Therefore, the books, articles, and theories that are older but still very much popular today have a higher likelihood of not only being valuable but true. Plus you have the ability to further confirm these older theories and opinions with the events and facts that’s occurred after their publishing.
And yet, every week New York Times updates its’ list of bestselling books and every week people look for the newest books, the newest theories. I’ve always been one of these people. I thought older books and theories were stale, boring, and likely irrelevant for most of the challenges I’ll encounter. However, theories don’t change that quickly.
The older, yet still popular, books and theories are the cornerstones for most of the ideas that people are coming up with today.
If you’re still skeptical, check out the bookshelf of Patrick Collison (Co-Founder & CEO of Stripe). Patrick is widely regarded as a prolific reader and intellectual and most of the books he recommends are over 10 years old.
Also, as a small aside, the present has never been a great judge of whether a piece of work would be valued in future generations. Many great writers, artists, and scientists passed away before they were recognized for their work.
Why read opinions based on using the scientific method?
Theories and ideas should be based on facts and causal relationships. Facts are generally easy to come by, but finding a causal relationship is much more difficult. The best way to determine if there is a causal relationship is to use the scientific method and run a controlled experiment. Lucky for us, some of the brightest people in the world have devoted their lives to academia and experiments.
These experiments help move theories and ideas from the subjective to the objective realm.
Sadly most of this academic research is kept in academic journals and is not that accessible to the general public. However, a small number of these academics (typically the more successful ones) choose to publish their research findings in books that use more accessible language- such as limiting jargon and complex math — and are easier for people to access (i.e., on Amazon or your public library). Given the rigor that goes into much of this type of research, we should place significant weight on these types of theories and ideas. Certainly much more weight than is generally given in today’s society.
“That’s how knowledge works. It builds up, like compound interest. All of you can do it, but I guarantee not many of you will do it.”
The automotive industry is an anomaly. The industry has annual worldwide sales of over $1.5 trillion. It’s dominated by a dozen powerful conglomerates each with distinct consumer brands. And, so far, it’s almost completely avoided the digital age and the effects this new age has on business models. All three of these unique traits will change over the next decade.
The rise of self-driving cars will remake the automotive industry, devastating most companies, and enriching a small few. Fortunately, there are many lessons from other industries that we can apply to understand what will likely happen in this new transportation industry.
Before diving into that, we first need to understand why the future of transportation is self-driving car fleets. I won’t spend much time on the topic as it’s been talked about extensively elsewhere, but it’s important to understand so we can build upon it later.
Self-driving car fleets
Currently, the average personal car utilization rate is ~5%. Under a well-optimized system, fleet self-driving vehicles could have a utilization rate of 50%+. This higher utilization means a lower cost to the end consumer.
Deloitte estimates that a personally owned vehicle costs ~$0.97 per mile and a self-driving car in a fleet will cost ~$0.30 per mile. Assuming a person drives 10,000 miles per year, that’s an annual savings of $6,700. These savings alone will likely be enough to convince large amounts of the population to switch to a Transportation as a Service (TaaS) system. Additionally, governments will likely see the safety and environmental benefits of self-driving fleets and in turn, disincentivize personal car ownership to help convince more people to switch.
Transportation as a Service
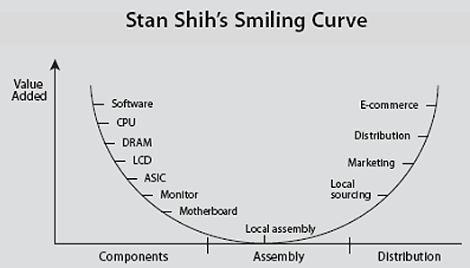
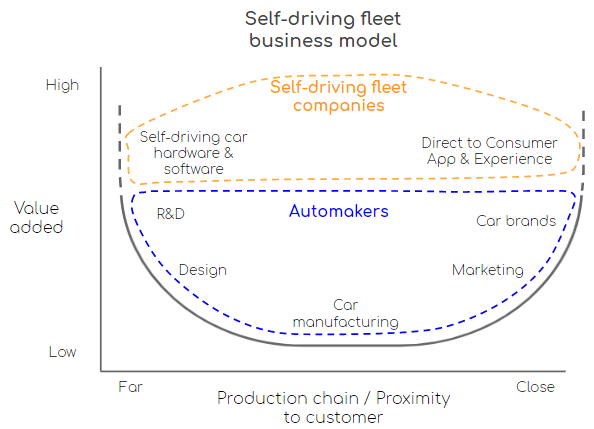
To understand how this new model will change the automotive industry, we can look at the personal computer (PC) and mobile industries. These industries have experienced significant changes over the last 30 years, but there has been one constant pattern throughout that time: the Smiling Curve.
Stan Shih’s original Smiling Curve
The Smiling Curve history
The Smiling Curve was created by Acer (a computer OEM firm) founder Stan Shih in 1992. The theory illustrates that the ends of the computer value chain command a higher value add. For instance, both Windows, who creates the software, and Intel, who owns the R&D for the main computer microchips, are able to capture most of the profit in the PC industry. The rest of the industry players are forced to compete for the leftovers.
On the distribution side, the ability to capture more of the value add has only increased since Shih developed the concept. The rise of the internet changed distribution by reducing the marginal cost of delivering digital services to basically zero. Now, Microsoft can deliver Windows to customers without any incremental delivery cost.
Apple took a unique strategic approach in both the PC and mobile industry, but one that still follows the Smiling Curve concept. Apple carved out the high value add activities, like software, design, and branding then outsourced the low value add activities, like manufacturing. However, in order for Apple’s integrated model to be viable, Apple needs to have a massive scale in order to recoup the significant fixed cost of software development and hardware design.
Meanwhile, other firms in both the PC and mobile industries had to follow behind modular solutions — Windows (for PCs) and Android (for mobile). Although these modular solutions have very different ways of monetizing, Microsoft and Google both fill this important role, which allows other firms to compete. At the same time though, Microsoft and Google filling this role permanently constrains these firms to only the low value add areas.
Applying the Smiling Curve to the auto industry
Currently, a dozen large conglomerates control most of the auto industry. And each conglomerate has adopted the same operational strategy — create a portfolio of different car brands (e.g., Jeep, Fiat, Chrysler), each with strong personas and cultural affiliations, and own the whole process from car concept creation to manufacturing. Thereby each conglomerate owns its own respective Smiling Curve.
Incumbent automaker’s business model
Since we can assume the future of transportation is fleet, we can start to make more assumptions on how the industry will change. Self-driving fleets will introduce three new important areas.
Sensory hardware — self-driving technology only works when the car has a precise 3-D map of its surrounding. To create this 3-D map, companies need to have good sensory technology. As such, some companies are now rushing to create their own sensory technology. Waymo has spent years and millions of dollars to create a proprietary system. General Motors acquired Strobe. Ford acquired Princeton Lightware. Meanwhile, other companies are choosing to partner — Toyota is partnering with Luminar and Velodyne is working with dozens of self-driving car programs.
Self-driving car software — this is the most challenging part. Building good software takes more than money. It takes time, data, and a culture built around the software development process.
Fleet networks — need to be deeply tied to the self-driving software. The TaaS model is centered around geographic hubs where cars are managed from central locations and then distributed across the city based on demand.
All three of these new areas are in the high value add part of the Smiling Curve. As such, the firm(s) providing these new products and services will capture the vast majority of the profit in the new ecosystem. That’s why there are 46 companies competing for a coveted spot in the self-driving car market.
In this new self-driving car fleet model, I believe two things are needed to succeed, each of which I’ll elaborate on in the two sections below. First, a firm’s self-driving car software needs to have massive scale. And second, the integration between the software and fleet operations needs to very strong.
The network effects of self-driving car software
Self-driving car software is unique. Most software is built using the Pareto Principle, or more commonly known as the 80/20 rule, where 80% of the benefit will come from 20% of the work. This is the right strategy when the software only needs to handle a handful of use cases. Self-driving car software is different though. The software needs to be able to handle 99.9999% of the possible use cases for a given geographical environment.
It’s that last 0.1% edge case that makes the software worth billions of dollars.
Thus, self-driving car software needs lots and lots of outliers to learn from and actually be useful.
Let’s take the example of an outlier scenario that occurs once every 10,000 miles. And let’s say that in order to learn how to drive in this outlier scenario, the software needs 100 different outlier scenarios data sets. Therefore, the software needs 1 million miles just to understand that one outlier scenario.
One way to find those outlier scenarios is to create them yourself, either through computer or closed road simulations. These simulations have a lot of benefits and are a great way to quickly test out how an updated software program will perform. However, simulated situations can never fully capture all the scenarios that will occur on the open road, whether it be a lidar sensor obstructed with bird droppings or a woman in an electric wheelchair chasing a duck in the middle of the road. The only way to understand all the outlier scenarios is to experience them first hand.
Another unique nuance of self-driving car software is that the whole process of learning these outlier scenarios will need to be repeated in every new geography. Each geography has unique terrain, weather, road layouts, and road norms. That’s why for instance people who believe self-driving car software should first start in easy to navigate areas like retirement communities are missing the point.
Firms that are building a self-driving car software that maxes out at 25 mph and only works in a constrained environment are building an entirely different product than one that can operate on public roads. Operating in an environment without outliers doesn’t improve the software, it confines the self-driving car software to the simplest of use cases.
Given this structural dependency on outliers, self-driving car software will have powerful network effects. The more people that ride using a specific self-driving software, the more outliers experienced, the better the passenger experience, the more people want to ride with that specific self-driving software. Some of this learning will be transferable across geographies, but a lot will be unique. Therefore, this network effect will need to occur in every new geographical area. Having 99.9999% effectiveness in Phoenix, Arizona doesn’t mean that the level of effectiveness will transfer to other cities.
We’ve seen these powerful network effects in software before and there are three different business models that work. First is the Apple approach, which used first-mover advantage and captured a large enough portion of the market to start the network effects. Second is the Android and Windows approach of modularizing the software so other firms can leverage the software in their own products. This way Android and Windows can use the sum total of all their users to push the network effects far enough along that no other firms can compete. The last approach is open source which allows the whole community to have the ability to access and improve the software. Thereby if the right incentive structure is in place, as the community scales so does the software.
Self-driving car software and fleet networks are unique again though. The Android and Windows approach only works because the connection between the software and hardware is static and passive. The connection between the self-driving car software and fleet operations will be dynamic and active. I’ll discuss this issue further in the section below but this dynamic nature will likely eliminate the Windows and Android approach as a viable self-driving car fleet business structure.
In order to work, the open source approach needs the proper incentive structure — which is very difficult to create. If a firm believes they can leverage the open source code and reach the network effects themselves, they’ll have no incentive to contribute its own learning to the source code.
In my opinion, this open source structure, or more likely a joint-venture, is automakers best hope of competing. Leveraging their combined power to remove this high-value add component would level the playing field for everyone. Yet, automakers don’t appear to show any desires to share learnings. And by the time they come around to the idea, they’ll likely already be out of the running.
Integration between software & fleet
Fleet operations will be complex. Unlike Uber today, fleets will have control over how many cars are in certain geographical areas, where cars should be placed down to the exact street level, and where cars should be driving to avoid high-risk areas. This complex operation will constantly be changing too, weather conditions, traffic, and user demand will always be in flux.
For instance, imagine its a rainy day in San Francisco at 3:00 pm on a Tuesday in February. Most K-12 students are finishing classes for the day. The rain has increased the chance of an accident on a few steep roads that collect rainwater run-off. Traffic is starting to increase and will continue to until the rush hour peak each weekday at 5:50 pm.
To manage this whole process, the system will need lots of feedback data. Self-driving cars will send automatic second by second status reports. At the end of each ride, customer feedback will be collected. The fleet operations software will analyze all this incoming data to run different scenarios and choose the optimal path forward.
In very unique risky cases (<0.01%), the self-driving car software may even need to have a human in the loop. Where a human quickly reviews a flagged situation and helps the software decide on a course of action. The self-driving car software system will need to analyze these status reports and make improvements to the model.
Once the self-driving car software team believes they have a more optimal model (which they’ve tested in simulations), the team will perform A/B tests before rolling it out to the entire fleet. During these tests, the fleet operators will need to randomize which cars receive the updated software to ensure the test’s validity.
As you can see, the integration between the self-driving car software and fleet operations will be strong. This entanglement points to a high probability of the self-driving car software and fleet operations being owned by the same firm. In other words, the modularized Android and Windows business model won’t work. The more vertical integration approach of Apple will likely be the best model. Integrating the self-driving car software and fleet networks will lead to a better user experience. The firm(s) that operate using this integrated approach though will need to have large sums of capital to move quickly to scale.
The new transportation business model
The first company or companies to reach the size necessary to start the network effect cycle will dominate the industry. As seen in the Smiling Curve above, these companies will be providing almost all the value add in the industry and, as such, will reap all the rewards. The actual cars themselves will become commoditized and undifferentiated. Similar to other transportation industries where the customer is not driving the vehicle (e.g., airplanes and trains) customers will only buy different levels of fares — economy, premium, business, etc.
Think about the Uber model today. Riders only care about how smooth the ride is, how expensive the ride is and how long it takes to get to the destination. They don’t care about how the engine feels or the quality of the stick shift. There are no personal brand affiliations. Riders don’t get more excited about a Toyota compared to a Ford. Most of the time riders don’t even notice the brand of the car. Fleet operators will become automakers’ direct customers and have the ability to assert price control.
These changes all point to the decimation of the incumbent automakers.
The large automaker conglomerates will be whittled down to only a small handful that are able to operate with the lower profit margins. Automakers only hope of escaping this future is to move up the Smiling Curve and own the software and fleet networks. However, I wouldn’t hold out hope — — my money’s on the companies that actually know how to build software.
Over the last ~100 years (founded in 1923) Disney has moved from a niche provider of animated children’s content to the largest and most powerful media entertainment company in the world. This massive growth was fueled by one underlying strategy, tent-pole content. Disney’s tent-pole strategy is to produce, license or acquire a blow-out film with the purpose of supporting a wide range of ancillary tie-in-products around the film and characters.
This strategy has been widely successful for Disney. Just look at Peter Pan, which came out in 1953 (although the original work debuted in 1904 and Disney licensed). It has had more than a dozen follow-on films and still survives today with multiple theme park rides and active theater tours around the world today.
Disney sees its IP (plots and characters) as a fixed cost. And with any fixed cost, the objective is always to use the fixed cost to create as much output as possible. Using this strategy, Disney built up an array of businesses and distribution channels to further monetize on its IP.
In 1984, once Disney had invested significant amounts of capital to build these businesses and distribution channels, it started focusing on broadening its audience outside of outside of youth entertainment. It created Touchstone Films to create more mature content like Pretty Woman and Good Morning, Vietnam. Then Disney went on a content acquisition spree to build its content in the adult and sports markets. Disney acquired or created:
Hollywood Pictures (1990)
Miramax (1993)
ABC/ESPN(1996)
Fox Family Network (2001)
Pixar Animation (2006)
Marvel Entertainment (2009)
Lucasfilm (2012)
21st Century Fox (2017)
Through all of these acquisitions and new units, Disney became the largest entertainment company in the world and now has content for every age group, from toddlers to senior citizens.
Disney was essentially creating a massive positive feedback loop. Because of Disney’s huge physical footprint and distribution channels, it could generate incremental revenue on content above what it’s competitors were able to generate and thereby could afford to spend more money than its competition on generating new content and capital expenditures, thereby continuing and reinforcing the cycle.
Industry Dynamics and Technological Changes
Historically, if you wanted to watch television, your home had to be hooked up to a cable distribution line through local utility poles or underground utility lines. However, cities and counties didn’t like the idea of having tons of cable companies digging through the city laying down cables. So cities limited the number of companies that could provide cable TV to one or two, thereby creating natural monopolies.
These natural monopolies limited content creators ability to have direct access with consumers. The cable technology and business model created two important industry dynamics.
Linear programming — shows are selected by the broadcaster in advance and then viewed at set times. Viewers cannot fast forward through the content or choose to watch content at a different time.
Cable companies have control of content — as cable companies control the actual wires that provide homes television, they are able to select what content they want available for their consumers. Cable companies negotiation rates with content producers for specific channels and generally pay a fixed amount per customer even if a customer doesn’t watch that channel.
Historically, these two factors made it so television content catered to the lowest common denominator. Where content was created to have mass-market appeal or appeal to a strong subset of the population, such as sports watchers. Additionally, there was a fixed capacity of content inventory because of the linear programming nature of television.
Both of these dynamics were eliminated with the advent of streaming media over the internet. A distribution channel was opened for content producers to have a direct relationship with the end-user and the end-user was able to have much more control of what they watched. These fundamental shifts lead to three important new industry dynamics.
Massive amounts of data on users watching patterns — with streaming, companies are able to know exactly how users consume content. They know when and where a show is paused, the exact second that viewers drop-off, and what shows have correlated viewers so they can understand underlying user preferences.
More personalized content for small sub-groups — as there is no limit to content inventory, more content can be produced for narrower sub-groups of society that typically wouldn’t have been big enough to warrant the cost of creating the content. Thereby the amount of content is significantly increased.
Increase in the number of content providers — with no entity selecting the specific content the end-users see, more people and companies can create and distribute content and the free market then decides what content is good or bad.
Netflix’s Rise
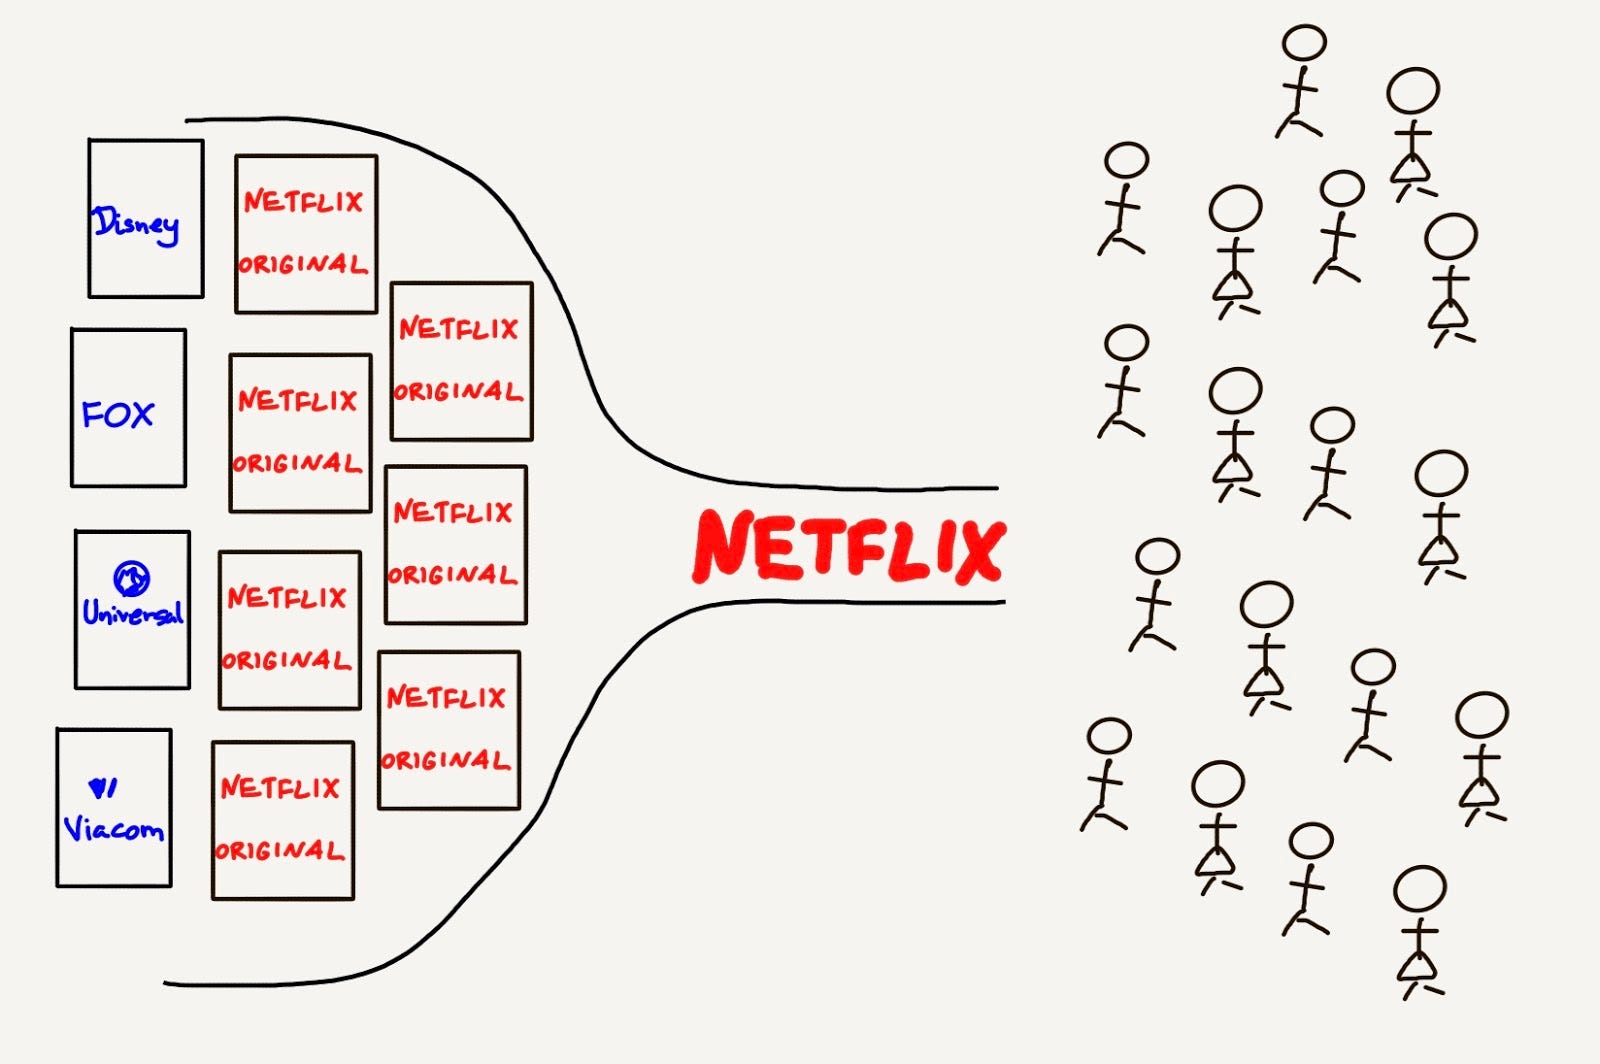
As most people are quite familiar with Netflix’s historical roots as a mail DVD rental company, I’ll skip over that and focus on how Netflix got to where it is and its core strategy.
Netflix started its online streaming business in 2007 as a content aggregator. End-users pay a fixed monthly subscription and Netflix uses this revenue to secure licensing agreements with content producers for content that Netflix believes it’s end-users want to watch. At the time, content producers, such as Disney, were happy to license their content to Netflix. They saw it as just another way to spread their IP as wide as possible and drive revenue over their fixed costs of creating the IP.
This content aggregation business model was very successful for Netflix, by the end of 2012, it had 27 million subscribers and almost $1 billion in revenue. However, Netflix rightly saw that the business model wasn’t sustainable. It was entirely dependent on content producers, 72% of its revenue went straight to content producers. And the larger Netflix grew, the more these content producers would see Netflix as a threat because Netflix threatened to erode their core television business and Netflix’s brand superseded theirs due to the direct to consumer relationship.
To combat these approaching risks, in 2013, Netflix moved swiftly into creating its own original content, with hit shows like House of Cards and Orange Is the New Black, and both were wildly successful. Fast forward to today and Netflix has 130 million subscribers and is spending $11 billion a year on original content and will release 700+ shows and 80+ new feature films in a single year. For comparison, Disney will only release 10 featured films this year.
from Stratechery by Ben Thompson
Moving forward, I see five core strategies Netflix will use to continue its high growth trajectory.
Create massives amounts of new content, especially shows — as shows naturally have more hours of content than movies and tend to leave subscribers more in suspense thereby encouraging them more to come back to Netflix on a recurring basis. Additionally, per dollar spent, shows typically produce more airtime than movies as the upfront cost (e.g., creating the set or finding actors) can be spread over multiple episodes and seasons.
Be the place where content creators want to come — historically, television and big-box-office movies have had more rigid guidelines on what would or wouldn’t be produced. Netflix can provide creators with more free reign because of its non-linear programming and serve as a desirable destination for more creative content and thereby decrease the amount Netflix spends acquiring content.
Use data to find preference groups and create tailored content for those groups — as I talked about in the industry and technology changes section, data and more personalized content is a cornerstone of streaming content. Netflix will be constantly analyzing it’s user data to find preferences and use that data to inform what types of new shows and films should be created.
Expand to new target demographics and regional based content — as Netflix increases market penetration, it’ll increasingly look to expand content for other age categories (mainly children) and expand internationally by creating culturally relevant content for different regions.
Focus on the technology and user experience — Netflix has always focused on providing a simple and powerful user experience down to the smallest elements. For example, a while ago, Netflix introduced the Skip Intro button, because data showed that a lot of consumers try to fast forward during that part and kept having to rewind to because they overshot the intro.
Disney’s Opportunity
The more I think about this competitive landscape and the effects of the technology changes, the more I think that Disney is perfectly set up for success. Disney’s strategy doesn’t need to drastically change, just the delivery mechanism does.
Arguably this new delivery mechanism serves Disney even better. Its brand will be more prominent in front of the consumer and Disney can finally own the direct consumer relationship and provide the exceptional customer experience it’s always provided in its theme parks.
Unlike Netflix, once Disney creates its direct to consumer apps and websites, it’ll immediately have a massive repository of old films and shows to make the product instantly desirable for target segments. And, at the same time, shift the focus of its studios slightly to creating content for that specific delivery channel. Additionally, as Disney has a vast array of other business lines, it’ll be able to spread all that new original content it produces across those other business units to generate additional revenue above and beyond what Netflix is able to do solely in the digital streaming space.
Don’t get me wrong though. Disney’s success certainly isn’t a certainty. In order to succeed in these shifting industry dynamics, Disney will need the right strategic vision and to execute extremely well. I see the following five points as crucial to Disney’s success.
Create three or four distinct content products. Disney’s greatest asset is its strength of content for huge swaths of user categories. They have content for kids, sports fans, older demographics, sci-fi nerds, non-fiction enthusiasts, and much more. By splitting up this content into many products, Disney can price segregate consumers and increase revenue. There are three obvious content products right now, sports (ESPN), kids (Disney), and more mature content (likely Hulu since Disney now owns ~60% of it). However, in time, with the further deterioration of television, I think they can add a fourth around news content that provides global to hyperlocal content.
Bundle in other products to the streaming services (think Amazon Prime). This is Disney’s core tent-pole strategy and it should drastically increase because of Disney’s direct access to its consumers. As Disney will have complete control over the user experience, Disney should market, bundle, and discount other Disney products and experiences. A subscription to Disney’s streaming service should be seen as the one-stop-shop for entertainment for children segment and eventually other segments too.
Keep advertising partially in the equation. Television advertising is a proven marketing medium and moving to streaming only providers more data to make it even more effective. Hulu currently offers two types of subscription packages, one with ads and one without. Disney should look to continue this strategy. The increased data associated with streaming and ability to directly link to advertiser content on-screen will increase the value of ads relative to traditional television. Additionally, having an ad and ad-free subscription allows for more price discrimination to reduce the demand surplus.
Create significantly more content, especially shows. As I outlined in Netflix’s core strategy, shows are fundamental to keep subscribers engaged and they are the most cost-effective content per hour. This is likely the main reason Disney’s acquired of 21st Century Fox, but Disney will still need to shift some of the studios to churning out more content as well in order to compete with Netflix’s volume.
Embrace the data and focus on the user experience. Moving to streaming opens a ton of great opportunities for Disney but also comes with a lot of risks. Disney needs to fully embrace its move into digital and adopt the best practices of leading internet companies. Specifically, Disney needs to focus on user experience and A/B testing, building a unified data storage to easily harness data, and, most importantly, moving quickly.
Only time will tell if Disney is able to set the correct strategic vision and execute on it effectively. At the time of writing this post, Disney is set to release its streaming service in late 2019 and it’ll be a year or two after that before we truly know the outcome.
Actively managed funds return a lot less than passively managed funds
Past outperformance by an actively managed fund gives no assurance that they will continue to do so in the future
A low management fee is the biggest predictor if a fund will perform well
Selecting an appropriate combination of stocks and bonds better predicts performance than investment selection
Stocks are inherently more risky than bonds, but historically have had a higher return
— — —
Active vs Passive Investing
Everyone has heard a story from a friend about someone who made thousands to millions of dollars ‘playing the market’. You’ve likely also seen some movies where a trader figures out a glitch in the market and thereafter make millions. However, these stories benefit from a selection bias, meaning you only hear about the rare large profitable investments and not the much more common losses. The only way to get a good picture of the investment landscape is to look at all of the data points over a long period of time (50+ years).
Fortunately, some of the smartest people (see underlying academic papers above) in the world have dedicated their life’s work to determine how best to go about investing and made their conclusions based off 50+ years of historical investment data. These landmark papers have compared the investment returns of actively managed funds (think mutual funds and hedge funds) to those of unmanaged benchmarks (think of the S&P 500 or the NASDAQ). And based on these comparisons they have concluded the following:
The average actively managed fund has had a lower return than comparable benchmark’s return (as much as 2.55% a year over a 15-year time frame!)
The comparison was even worse when accounting for survivorship bias — meaning the funds that don’t perform and are shut down are still taken into account
Persistence of performance among past winners is no more predictable than a coin flip
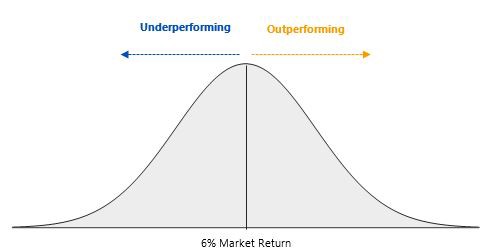
The theory underpinning why this is the case is called the ‘zero-sum game’. It states that all of the holdings of investors collectively form the market and that the average performance of the market is just the average of the return of each investor. Therefore, if one investor outperforms the market, another investors is on the opposite side of the trade and is underperforming relative to the market.
To really drive the concept home, let’s try to visualize it. So the diagram below represents all of the returns of every single investor (creating a bell curve) with the center being the return of the market at 6%.
Now let’s add two investors to the return graph, investor A and investor B, with returns of 13% and -1%, respectively. In order for investor A to receive a return of 12% it needs investor B (or alike investor) to be on the opposite side of its trades, otherwise, investor A wouldn’t be able to buy or sell any of its investments. This where the theory ‘zero-sum game’ gets its name. If you were to add up all the returns of each investor, it would always equal the return of the market.
This means that in order for an investor to outperform the market on a repeatable basis it needs other investors continuously on the other side of the equation (underperforming relative to the market) to make the trade work. This begs the question, if you were consistently underperforming relative to the market would you continue to invest the same way? Likely not.
So investors are continuously ‘dropping out’ of the active investing game and merely buying indexes to track the market and receive a 6% return (in this case). This continuous loss of underperforming investors causes the sophisticated outperforming investors to have to compete with each other and end up on the underperforming side of the equation from time to time.
The next thing to factor in is the management fee that active fund managers typically charge, typically ranging from 0.50% to 2.00%. These fees automatically handicap them and force them to not only match the return of the market (which is difficult by itself) but beat it by more than their management fee. Take the example below with a 1.00% management fee:
Because of the active fund managers management fee of 1.00% the entire return spectrum shifts to the left. Although a portion of the blue bell curve does lie to the right of the market return, it represents a much smaller number of investors due to the high management fee.
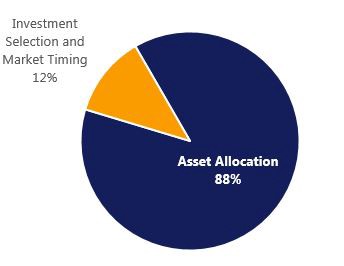
Hopefully, by now you agree that it is very difficult (near impossible after fees) to repeatedly outperform the market. If not, come back in 5 years or so when you’ve started to see the light by looking at your own investment returns. The next challenge that the researchers took on was determining the optimal asset allocation. By asset allocation, I’m referring to the mix of bonds, stocks, and cash in a portfolio (there are other asset classes too like real estate and commodities, but we’ll stick with the simple ones for now). The researchers determined that selecting an appropriate asset allocation is more important than selecting the individual funds that you invest in. In fact, research from Vanguard has determined that 88% of a portfolio’s return can be exampled only by asset allocation, with the remaining 12% determined by investment selection and market-timing (assuming a diversified portfolio).
Percentage of return explained by:
This means that simply by investing 80% in stocks and 20% in bonds, you’ve already determined your portfolio’s volatility even before selecting stock or bond indexes.
Decades of research have shown that stocks are inherently more risky than bonds. So when figuring out how to invest your portfolio the first thing to determine is how much risk you are able and willing to accept. Since stocks are inherently more risky than bonds, investors demand a higher return from them. Otherwise, investors would only invest in less risky assets with higher returns. So the general concept is:
More Risk = More Return
Less Risk = Less Return
So a portfolio with 80% stocks and 20% bonds will be lot more risky and likely return a lot higher than a portfolio of 50% stocks and 50% bonds. Therefore, when you’re thinking about how exactly you should invest focus a lot more on the combination of stocks to bonds than the specific investments you’re actually investing in.